View the DLP dashboard
View the DLP dashboard to see real-time evaluation statistics: request volume, decision breakdown, most triggered rules and per-platform distribution.
Permissions
info
This action requires the following DLP (Data Loss Prevention) role:
- viewer
- Console
- API
Console
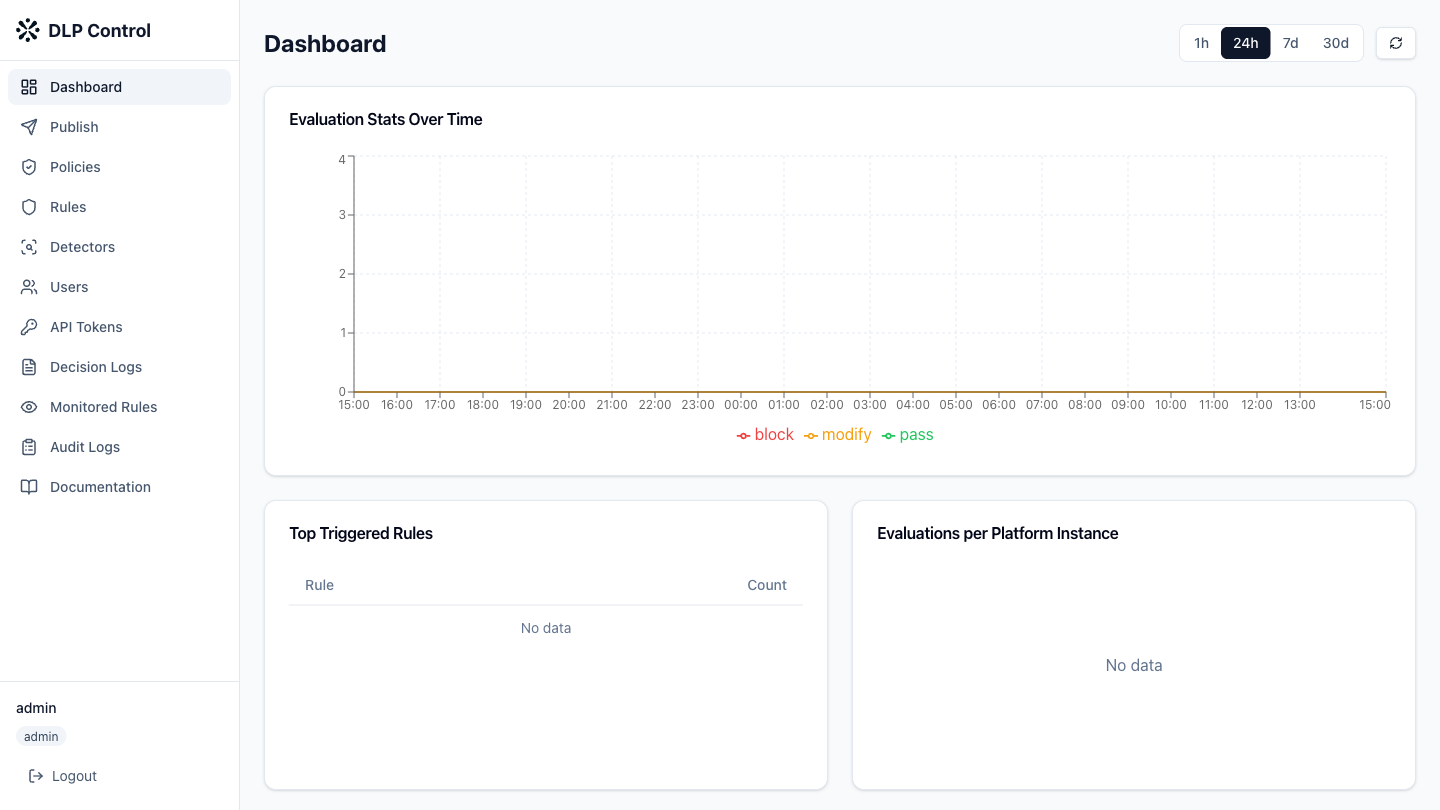
- Go to the DLP console dashboard.
The dashboard displays the following elements:
Evaluation statistics
- Time range selector: choose the time period — 1h, 24h, 7d or 30d;
- Line chart: evolution of evaluations over time, broken down by decision type (
pass,block,modify,monitor); - Bar chart: most triggered rules over the selected period;
- Pie chart: distribution of evaluations by consuming platform.
Recent decisions
The recent decisions table displays the latest blocked or modified evaluations, with:
- the request identifier;
- the consuming platform;
- the decision rendered;
- the rules triggered;
- the timestamp.
The GET /api/v1/dashboard/stats request retrieves dashboard statistics.
Query parameters
| Parameter | Description |
|---|---|
range | Time period: 1h, 24h, 7d or 30d |
Response example
{
  "evaluations": [
    {
      "timestamp": "2026-08-27T14:00:00Z",
      "pass": 8420,
      "block": 156,
      "modify": 23,
      "monitor": 8
    }
  ],
  "top_rules": [
    {
      "rule_id": "rule-550e8400",
      "rule_name": "block-aws-keys",
      "count": 156
    }
  ],
  "per_platform": [
    {
      "platform_instance": "mistral-prod-eu",
      "total": 8607
    }
  ]
}